1
|
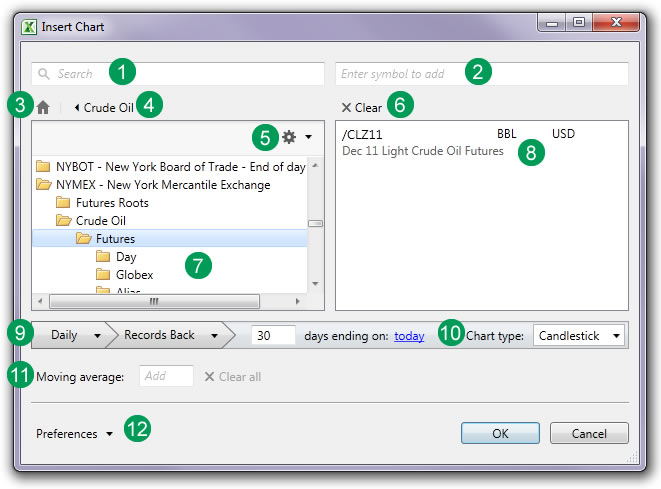
SEARCH: Enter one or more words that describe the symbol or category you want. The more information you enter, the finer the search results will be. View more information about Symbol Search.
|
2
|
When you know the specific symbols you want, enter the desired symbols here. Examples:
- Enter /CLZ11 for December 2011 Light Crude Oil Futures
- Enter /NGS11 for November 2011 Globex Natural Gas Futures
- Enter /HO<3> for the (Continuous) 4th Month NYMEX Heating Oil
|
3
|
Click the  HOME icon to go back to the start of the Symbol Tree. View more information about Symbol Tree. HOME icon to go back to the start of the Symbol Tree. View more information about Symbol Tree. |
4
|
Click the back arrow to go back one step in the Symbol Tree. |
5
|
Displays any Filters saved in the Symbol Tree Settings (unpermissioned and expired contracts).
Click the Settings icon  to change the View (Tree or Slider) Filters. to change the View (Tree or Slider) Filters.
|
6
|
Click the X to Clear all the selected symbols and start over.
|
7
|
The left side displays the results of a SEARCH, or the symbols found by moving through the Symbol Tree.
|
8
|
Symbols selected to appear on your spreadsheet are listed in the right side of the dialog box. The Unit of Measure and Currency is displayed for each symbol, and can be changed by clicking on them.
When the unit of measure or the currency has been changed, this is reflected in the chart's price scale and description. |
9
|
Select the time series (Daily, Weekly, Monthly, Quarterly, Yearly, Intraday, Seasonal) and either the number of records back or date range. See the Chart Time Series topic for more information. |
10
|
Select the Chart Type (Open, High, Low, Close, Midpoint, Volume, Candlesick, or Bar Chart). |
11
|
Additional display settings for the quoteboard that will display for the supporting data (Header and Data optionss) are chosen in the Preferences area of the dialog box. |