Help Files
Trendlines
| MarketView > Charts > Trendlines |
MarketView charts support the use of both free-form and calculated trendlines. Trendlines are applied and managed in charts via the drawing toolbar.
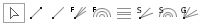
The drawing tool bar is located directly above the chart, next to the time series drop down.
|
Line |
|
|
Ray |
|
|
Fibonacci Fan |
Lines are displayed by drawing a trendline between two extreme points, for example, a trough and opposing peak. Then an "invisible" vertical line is drawn through the second extreme point. Three trendlines are then drawn from the first extreme point so they pass through the invisible vertical line at the Fibonacci levels of 38.2%, 50.0%, and 61.8%. |
|
Fibonacci Arc |
Is displayed by first drawing a trendline between two extreme points, for example, a trough and opposing peak. Three arcs are then drawn, centered on the second extreme point, so they intersect the trendline at the Fibonacci levels of 38.2%, 50.0%, and 61.8%. Note that the points where the Arcs cross the price data will vary depending on the scaling of the chart.23.6% and 78.62% |
|
Fibonacci Retracement |
Is a three-line indicator with 0 and 100 hundred applied as upper & lower bounds. It is displayed by drawing a trend line between two extreme points, for example, a trough and opposing peak. An "invisible" vertical line is drawn through the second extreme point, then three trend lines are drawn from the first extreme point so they pass through the invisible vertical line at the Fibonacci levels of 0, 23.6, 38.2, 50.0, 61.8, 78.62, and 100 percent. The primary, 0.0%, 100% are solid lines while the others are dotted. |
|
Speed Resistance |
|
|
Speed Arc |
|
|
Gann Fan |
Is displayed by drawing the primary line at the equivalent of a 1x1 relationship to the scale of the chart. Two lines are then drawn “above” and “below” the line at the following intervals: · 1 x 4 · 1 x 2 · PRIMARY LINE - 1x1 relationship between X and Y axis · 2 x 1 · 4 x 1 When drawing a Gann Fan, the user is prompted with a dialog to set options for drawing of the Gann Fan: 1. The user is first prompted to select the Y-axis increment to be used in the 1x1 relationship. This value will be editable (free form) and labeled as “Points per bar” o X-axis increments will be determined using the period selection of the chart (e.g. daily, weekly, etc.). 2. The user will be prompted to choose which direction the lines will be drawn. o It is assumed that the line to be drawn from left to right across the chart. 3. The user will have the option to select drawing the lines up or down. o This option will be presented with two checkboxes labeled “Down Right” and “Up Right”. The user can invoke the dialog again to change these settings via a right-mouse click menu. The drawing of the Primary Line is dictated by the application using the 1x1 relationship defined by the user. The user is only able to change the line by adjusting the 1x1 settings. |
Edit trendlines by selecting the mouse cursor  from the drawing toolbar. Then select the desired trendline using a single left mouse click on any of the visible handles or square boxes on each end of the primary line. The trendline's size and position is then adjusted by using the left mouse button and “dragging” the primary line’s end point to a new location. The trendline redraws to reflect the new coordinates of the primary line.
Move a trendline by selecting the mouse cursor from the drawing toolbar. Then click and and drag the desired tredline into its new position.


