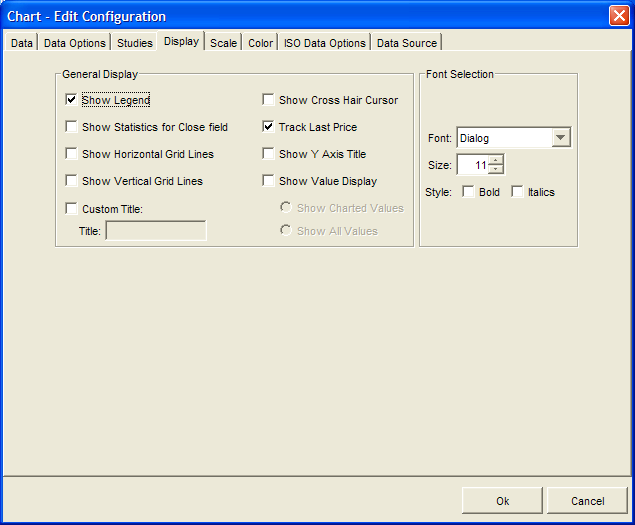

The Display Tab for the Chart component defines scaling and visual configuration of the component.

Show Legend: This check box toggles the display of the chart's legend.
Show Statistics for Close field: This check box toggles the display of the Min, Max, Mean, and Standard Deviation (SD) statistics in the chart legend. All statistic values are calculated based on the Close field for each displayed symbol. If the Close field for a given symbol is not displayed in the chart, the statistics will not be calculated and the user will see "N/A" in place of the statistic values.
Show Horizontal Grid Lines: This check box allows the user to toggle the horizontal grid lines in the chart.
Show Vertical Grid Lines: This check box allows the user to toggle the vertical grid lines in the chart.
Custom Title: This check box allows the user to specify a custom title for the Chart. If it is unchecked, the system will title the current instance of the Chart component based on the symbol or symbols being charted using a comma separated list of the symbols names. If it is checked, the Title text box becomes enabled and the user can specify a custom title which will be displayed in the title bar of the chart.
Show Cross Hair Cursor: This check box allows the user to display the cross hair cursor in the chart.
Track Last Price: This check box allows the user to display the last price flag in the chart.
Show Y Axis Title: This check box allows the user to toggle the Y axis title. If selected the abbreviation for the selected currency and units will be displayed i.e. USD/BBL
Show Value Display: This check box toggles the display of the Value Display popup window. The Value Display indicates the actual values at a given point along the X-axis. In addition, the display of the Value Display can be toggled by clicking on the chart.
Show Charted Values: This option formats the Show Value Display popup window to only display field values currently being charted.
Show All Values: This option formats the Show Value Display popup window to display all values for each symbol regardless of whether they are being charted.
Font: This drop down control allows the user to select from a list of available fonts to be used in the component display.
Size: This spinner control allows the user to select a font size for use in the component display. Valid values range from 6-48 point size.
Style: These checkbox controls allow the user to display the selected font in either bold or italics in the component display.

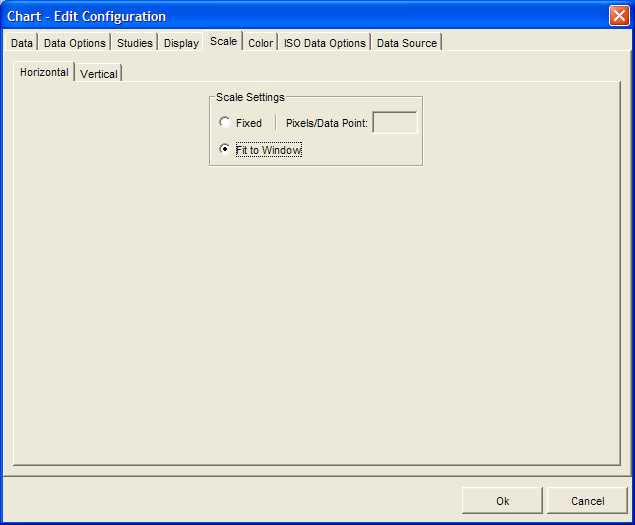
This option group specifies how the time or X-axis is scaled.
Fixed: This option fixes the horizontal viewable portion of the chart or view port based on a given number of pixels per data point.
Pixels/Data Point: This text box defines the number pixels used to display each data point in the view port for charts that have fixed horizontal scaling. This field is unavailable unless Fixed is selected
Fit To Window: This option forces the chart to fit with in the current window size.

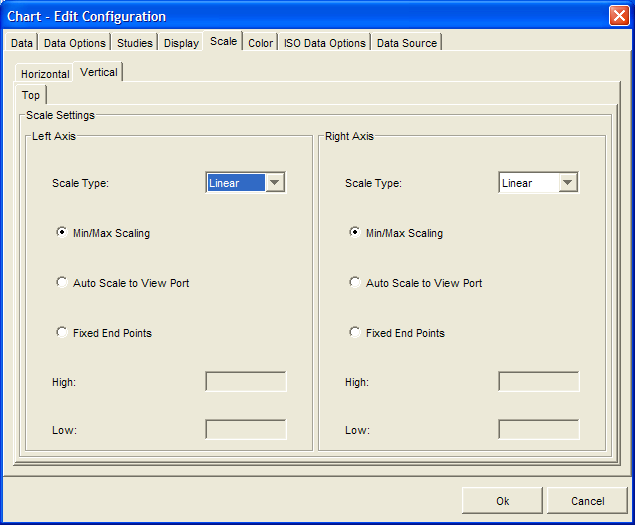
This option group allows the user to specify how the data value or Y-axis is scaled.
Scale Type: User has the ability to set Left and Right Axis to display data in either Linear or Logarithmic scale type
Min/Max Scaling: This option selects appropriate minimum and maximum values for the Y-axis based on the entire time series being charted.
Auto Scale: This option selects a range of values solely based on the viewable portion of the chart or view port. As the user scrolls left or right the range will change as needed.
Fixed End Points: This option allows the user to specify a fixed range for the Y-axis. This range is maintained regardless of the view port and therefore it is possible for the view port to contain no data since it could be greater or less then the current fixed end points.
Left & Right: Since a chart can have two Y-axis scales the user can define two sets of High and Low values for fixed end points.
High: These text boxes allow the user to specify the high value for the Fixed End Points vertical scrolling option to define a vertical view port. This field is disabled unless Fixed End Points is selected.
Low: These text boxes allow the user to specify the low value for the Fixed End Points vertical scrolling option to define a vertical view port. This field is disabled unless Fixed End Points is selected.